What Are Earthquakes and How Are They Measured?
Learn what causes earthquakes, how seismographs detect seismic waves, what the Richter and Moment Magnitude scales mean, and where the world's most dangerous earthquake zones are.
Learn what causes earthquakes, how seismographs detect seismic waves, what the Richter and Moment Magnitude scales mean, and where the world's most dangerous earthquake zones are.
At 5:04 p.m. on October 17, 1989, with tens of thousands of baseball fans settling into their seats in San Francisco’s Candlestick Park for Game 3 of the World Series, the ground lurched. The Loma Prieta earthquake — magnitude 6.9 — lasted just 15 seconds. It collapsed a section of the Bay Bridge, pancaked an elevated highway in Oakland, and killed 63 people. Sixty-three people in one of the world’s most earthquake-prepared cities, in one of the world’s wealthiest countries, during 15 seconds.
The following year, a magnitude 7.7 earthquake struck a remote region of northwestern Iran, killing around 50,000 people. In 2010, a magnitude 7.0 earthquake devastated Haiti, killing over 200,000. Earthquakes are among the most capricious and destructive forces in nature — and despite more than a century of careful scientific study, we cannot predict them with any useful precision. What we can do is understand them: where they happen, why they happen, how the ground moves, and how we measure that motion.
The vast majority of earthquakes are tectonic in origin. The movement of enormous slabs of lithosphere, called tectonic plates, causes these quakes. These plates make up Earth’s outer shell.
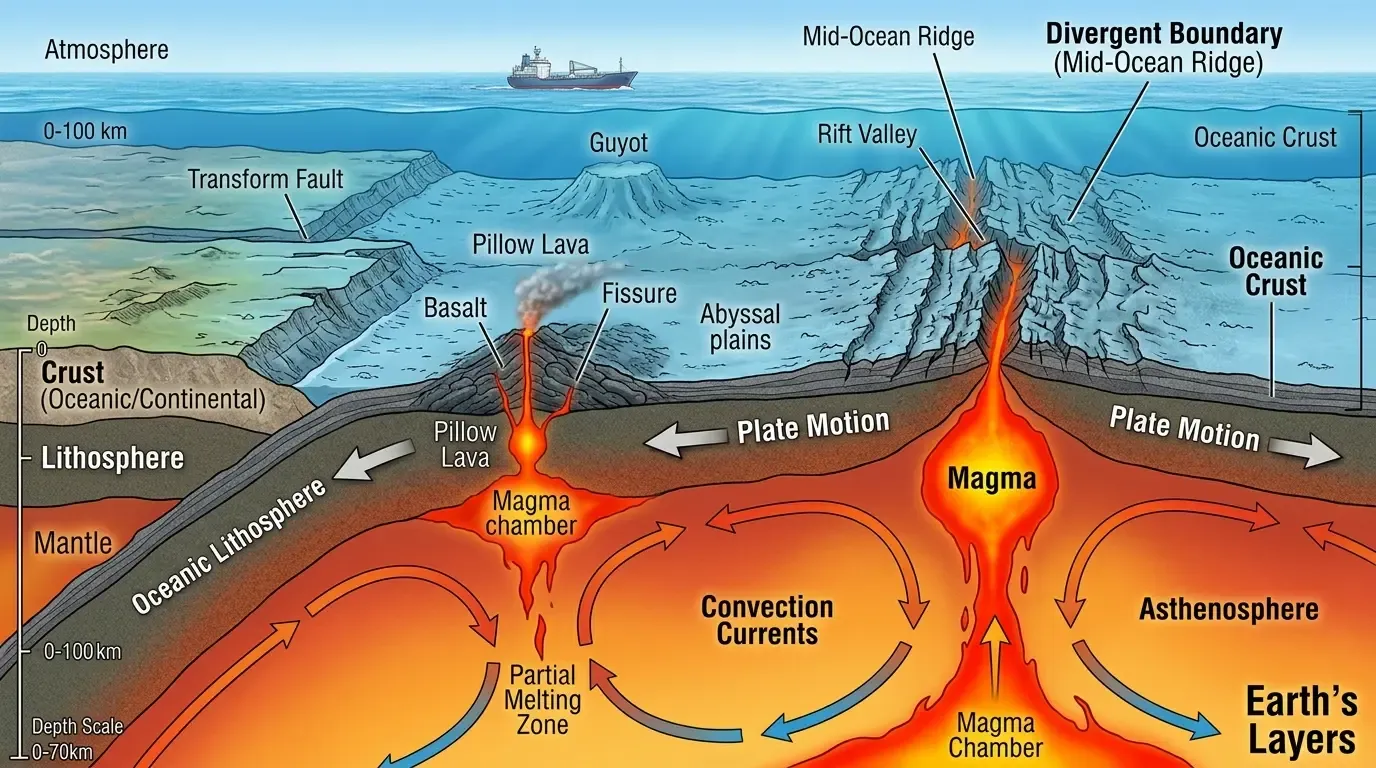
These plates are in constant slow motion, driven by convection currents in the mantle below. Wherever plates meet, enormous forces act on the rock at their margins.
At transform boundaries, two plates grind horizontally past each other. At convergent boundaries, plates collide — one often diving beneath the other in a process called subduction. At divergent boundaries, plates pull apart. All three boundary types generate earthquakes, though the largest tend to occur at subduction zones.
The key to understanding earthquakes is elastic rebound theory. Geologist Harry Reid first clearly described this theory after studying the 1906 San Francisco earthquake.
Rock is elastic — it can bend and deform slightly under stress. As tectonic plates move, stress accumulates in the rock at their boundaries, just as stress builds in a stick bent slowly across your knee. For decades, even centuries, the rock deforms elastically, storing energy. The locked zone between the plates doesn’t move because friction holds it in place.
Then, when the accumulated stress exceeds the strength of the rock (or the friction holding the fault locked), the fault ruptures suddenly. The rock snaps back into a new position, releasing the stored elastic energy as seismic waves — an earthquake.
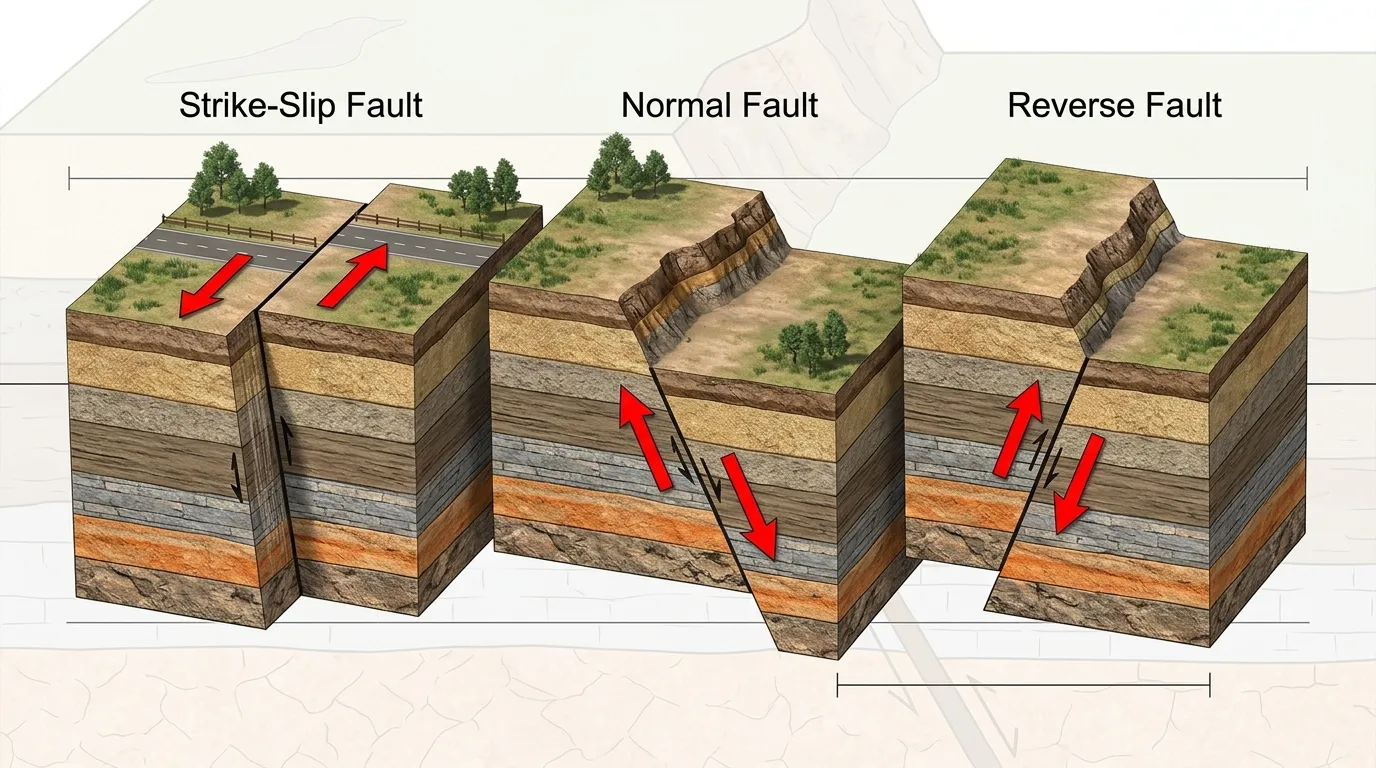
A fault is a fracture in Earth’s crust along which movement has occurred. Most major earthquakes occur on pre-existing faults. The San Andreas Fault in California, the Anatolian Fault in Turkey, the Alpine Fault in New Zealand — these are long-established zones of weakness where plates are in contact.
Faults are classified by the direction of movement:
Not all earthquakes originate at plate boundaries. Intraplate earthquakes occur within the interior of plates, often on ancient faults reactivated by distant tectonic forces. The New Madrid Seismic Zone in the central United States — far from any plate boundary — produced a series of magnitude 7–8 earthquakes between 1811 and 1812, among the largest in North American history.
While tectonic earthquakes dominate, other mechanisms can trigger them. Volcanic earthquakes occur as magma forces its way through rock, fracturing it. Collapse earthquakes happen when underground caverns or mine tunnels collapse. Induced seismicity — earthquakes triggered by human activity — has become increasingly important: the injection of wastewater from oil and gas operations (including hydraulic fracturing, or fracking) into deep disposal wells has triggered thousands of small-to-moderate earthquakes in parts of the United States, particularly Oklahoma and Texas. Reservoir-induced seismicity, caused by the weight and water pressure of large dams, has also been documented.
The point inside the Earth where the fault first ruptures is called the hypocenter (or focus). Earthquakes can originate at shallow depths (within 70 km of the surface), intermediate depths (70–300 km), or deep depths (300–700 km). Shallow earthquakes tend to be the most destructive because the seismic energy has less distance to travel before reaching the surface.
Directly above the hypocenter on the Earth’s surface is the epicenter — the point that typically experiences the most intense shaking and is the reference point used in earthquake location reporting.
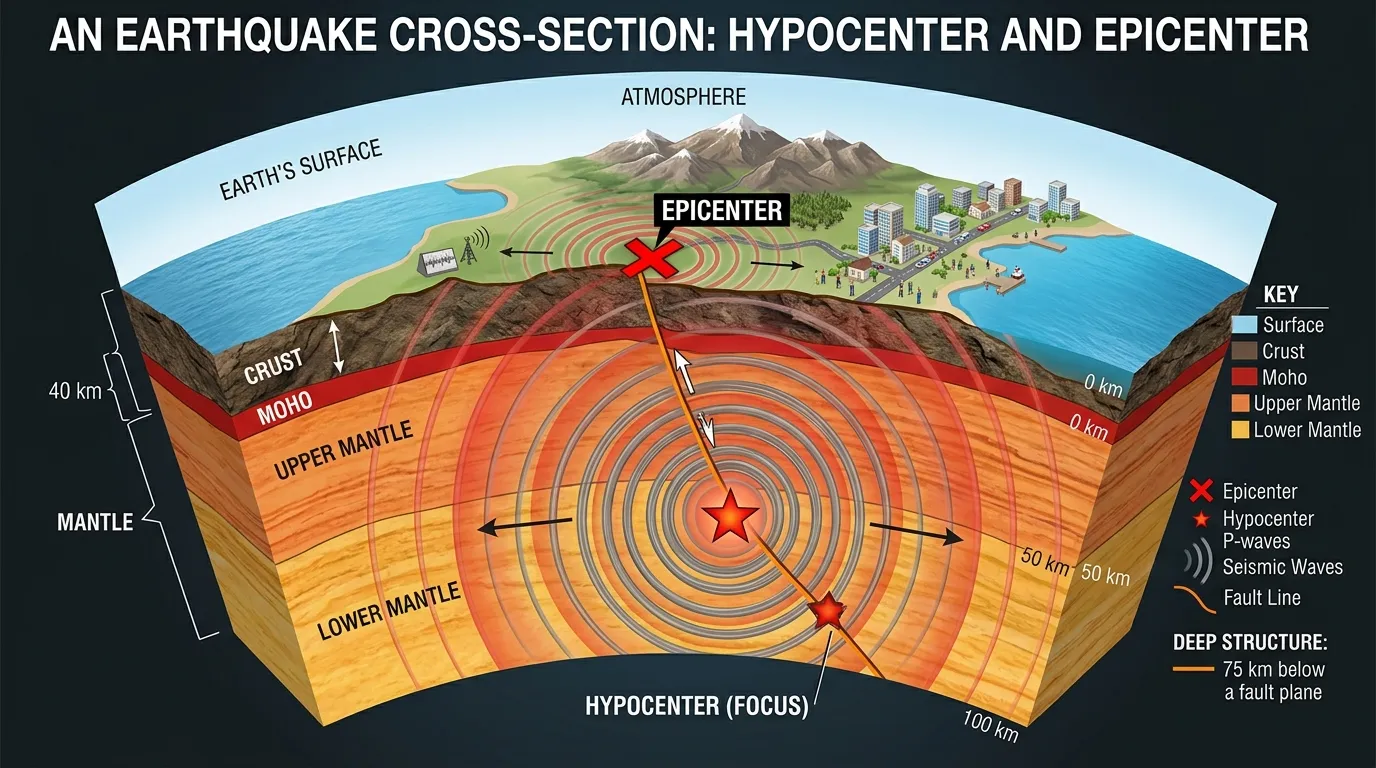
An earthquake doesn’t move the ground in a single lurch — it sends out waves of energy in all directions from the hypocenter. These seismic waves fall into two main categories.
Body waves travel through the interior of the Earth:
Surface waves travel along the Earth’s surface and are generally the most destructive to buildings:
Surface waves travel more slowly than body waves but carry more energy at the surface — which is why buildings can still be swaying long after the initial P-wave has passed.
[!NOTE] The time difference between the arrival of P-waves and S-waves at a seismograph station is how seismologists calculate the distance to an earthquake’s epicenter. The longer the gap between P and S arrivals, the farther away the earthquake occurred.
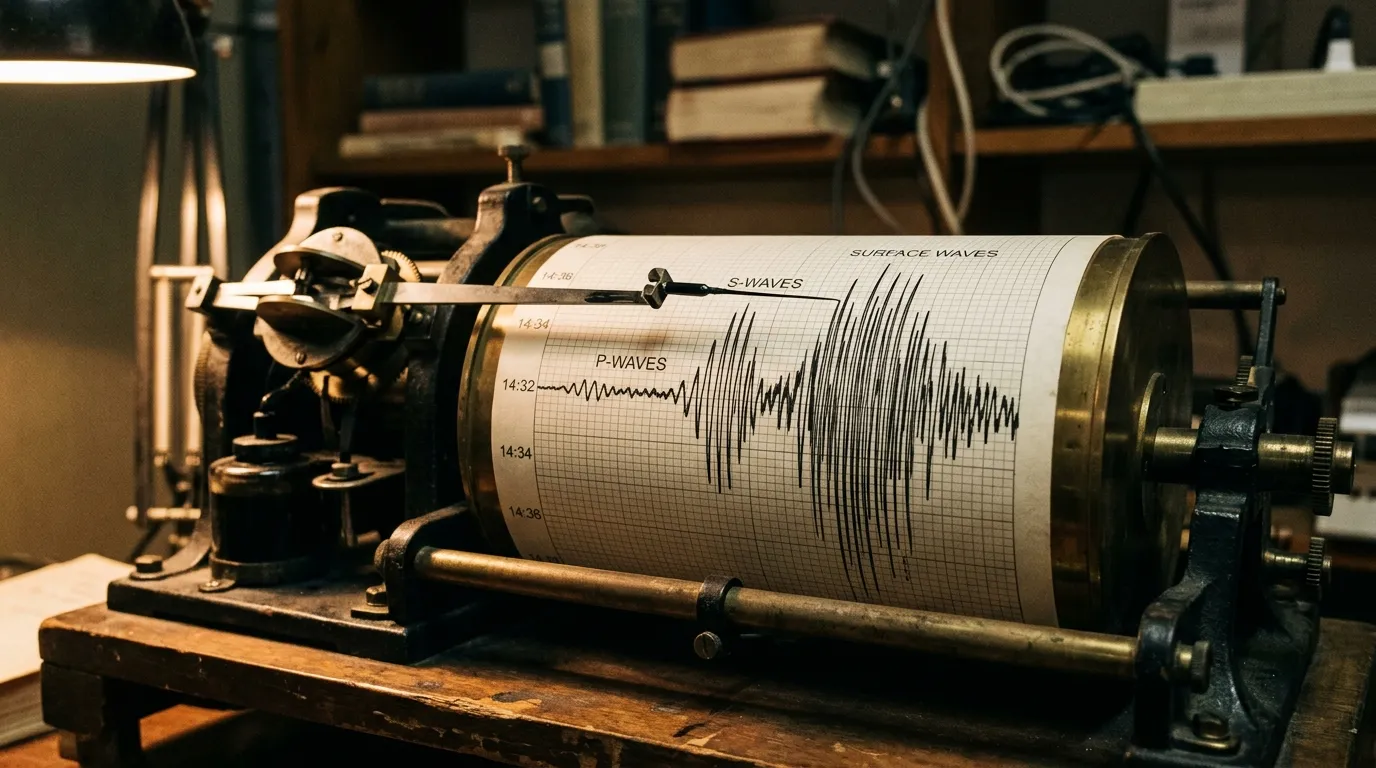
A seismograph (or seismometer) detects and records the motion of the ground. The classic design exploits the principle of inertia: a heavy mass is suspended by a spring from a frame anchored to the ground. When the ground shakes, the frame moves with it, but the inertia of the heavy mass tends to keep it stationary. This relative motion between the mass and the frame is recorded — originally as a tracing on a rotating drum of paper (a seismogram), now as a digital signal.
Modern seismographs are extraordinarily sensitive. High-quality instruments can detect ground motion as small as a nanometre — roughly the width of a few atoms. They routinely record earthquakes occurring on the other side of the planet. Networks of seismographs, linked electronically, allow geologists to pinpoint earthquake locations anywhere on Earth within minutes.
A seismogram shows ground motion over time. On a typical seismogram, the first, small-amplitude wiggles are the P-waves; they arrive first but cause relatively little shaking. Then come the S-waves — larger amplitude, slightly later. Finally, the large rolling waves of surface energy arrive, often dwarfing the body waves in amplitude and potentially lasting for several minutes after the initial rupture.
The pattern and timing of arrivals from multiple seismograph stations allow seismologists to locate the hypocenter precisely, determine the orientation and mechanics of the fault rupture, and estimate the energy released.
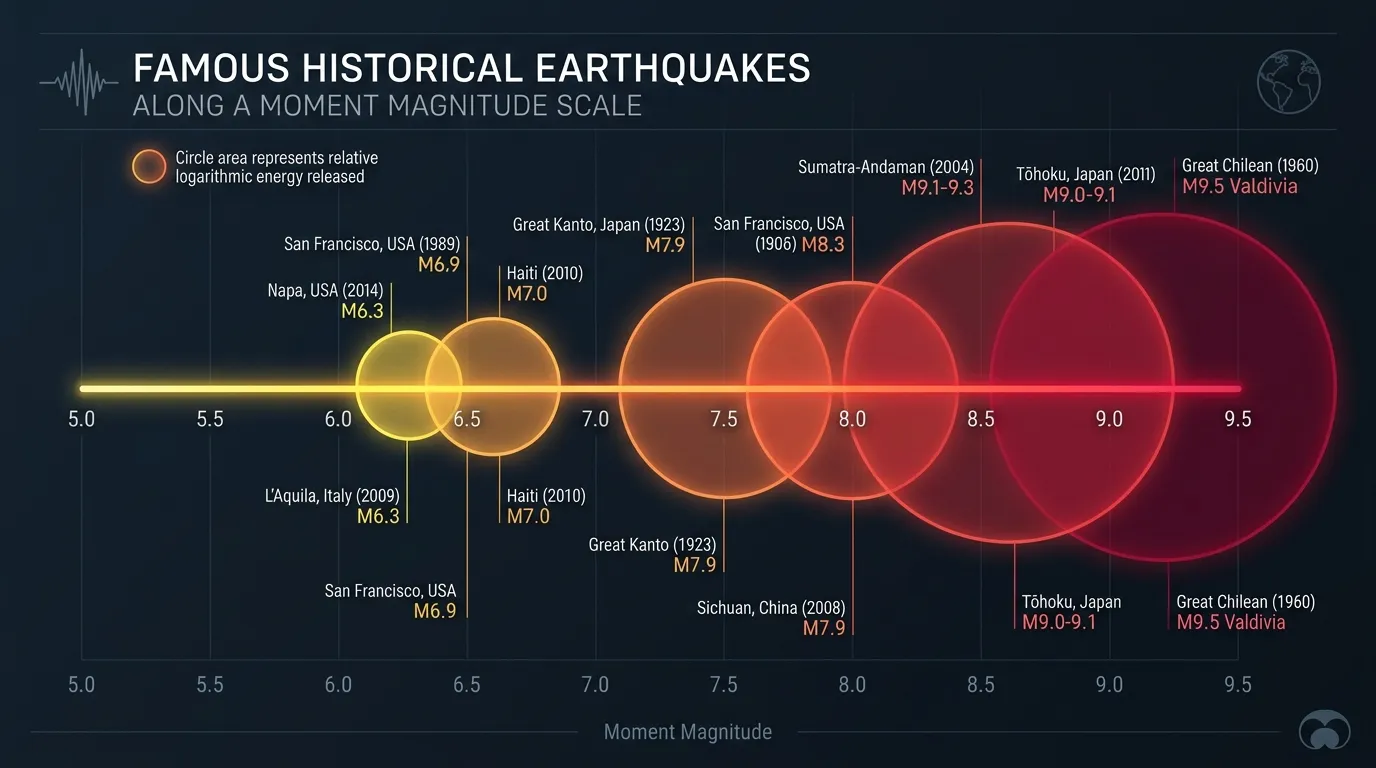
In 1935, Charles Richter of the California Institute of Technology developed the first quantitative scale for comparing earthquake sizes. The Richter Scale (more precisely, the local magnitude scale, M_L) was based on the amplitude of the largest wave on a seismogram recorded by a specific type of seismograph at a specific distance (100 km from the epicenter). The scale is logarithmic: each whole number increase represents a 10-fold increase in wave amplitude and roughly a 31.6-fold increase in the energy released.
This means the difference between a magnitude 5 and a magnitude 7 earthquake is not “twice as big” — a M7 releases about 1,000 times more energy. A M8 releases about 32,000 times more energy than a M5.
The Richter scale worked well for moderate, shallow earthquakes in California — but it became unreliable for very large or very distant earthquakes, and for measuring deep earthquakes. A more fundamental measure was needed.
The Moment Magnitude Scale (M_w), developed by seismologists Hiroo Kanamori and Thomas Hanks in the late 1970s, is now the standard measure used by seismologists worldwide. It is based on the seismic moment — the physical amount of energy released, calculated from the area of the fault that ruptured, the average amount of slip along the fault, and the rigidity of the rock. The moment magnitude scale agrees numerically with the Richter scale in the moderate magnitude range (M4–7) but remains accurate and meaningful at all magnitudes.
For the largest earthquakes, the numbers become staggering. The 1960 Valdivia earthquake in Chile — the largest ever recorded — had a moment magnitude of 9.5. The fault rupture extended roughly 1,000 km along the Chilean coast. The earthquake caused a Pacific-wide tsunami that killed people as far away as Japan and Hawaii. The 2011 Tōhoku earthquake in Japan (M9.1) generated a tsunami that killed nearly 20,000 people and caused the Fukushima nuclear disaster.
While magnitude measures the energy released at the source, intensity describes the effect on people, buildings, and the ground at a particular location. The Modified Mercalli Intensity (MMI) Scale runs from I (not felt except by very few people) to XII (total destruction). A single earthquake produces one magnitude but many different intensities, decreasing with distance from the epicenter and varying with local geology. Soft sediments amplify shaking dramatically — this is why damage in the 1989 Loma Prieta earthquake was much worse in districts of San Francisco built on filled bay mud than in those built on bedrock.
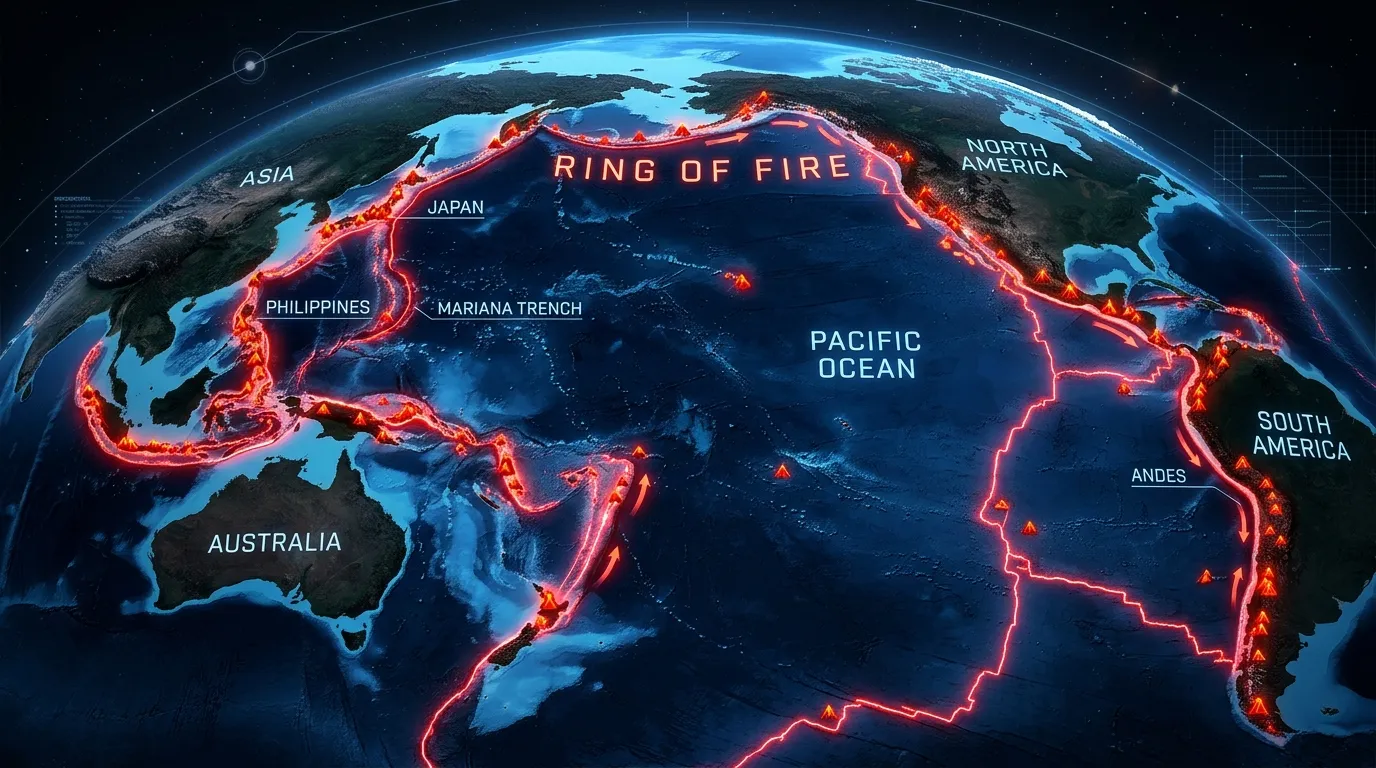
Earthquakes are not randomly distributed across the globe. They cluster almost entirely along plate boundaries. The single most seismically active region on Earth is the Ring of Fire — a horseshoe-shaped belt encircling the Pacific Ocean, where the Pacific Plate and several neighbouring plates are subducting beneath surrounding continental and oceanic plates. About 90% of the world’s earthquakes and about 81% of the world’s largest earthquakes occur along the Ring of Fire.
The subduction zones of the Ring of Fire include:
Beyond the Ring of Fire, the Alpide Belt stretches from Portugal through the Mediterranean, Turkey, Iran, and the Himalayas to Southeast Asia — the result of the collision between the African, Arabian, and Indian plates and the Eurasian plate. The 2023 Kahramanmaraş earthquakes in Turkey (M7.8 and M7.5) that killed over 50,000 people occurred in this belt.
For a deeper understanding of why these zones exist, see our companion article on Plate Tectonics: How the Earth’s Crust Moves.
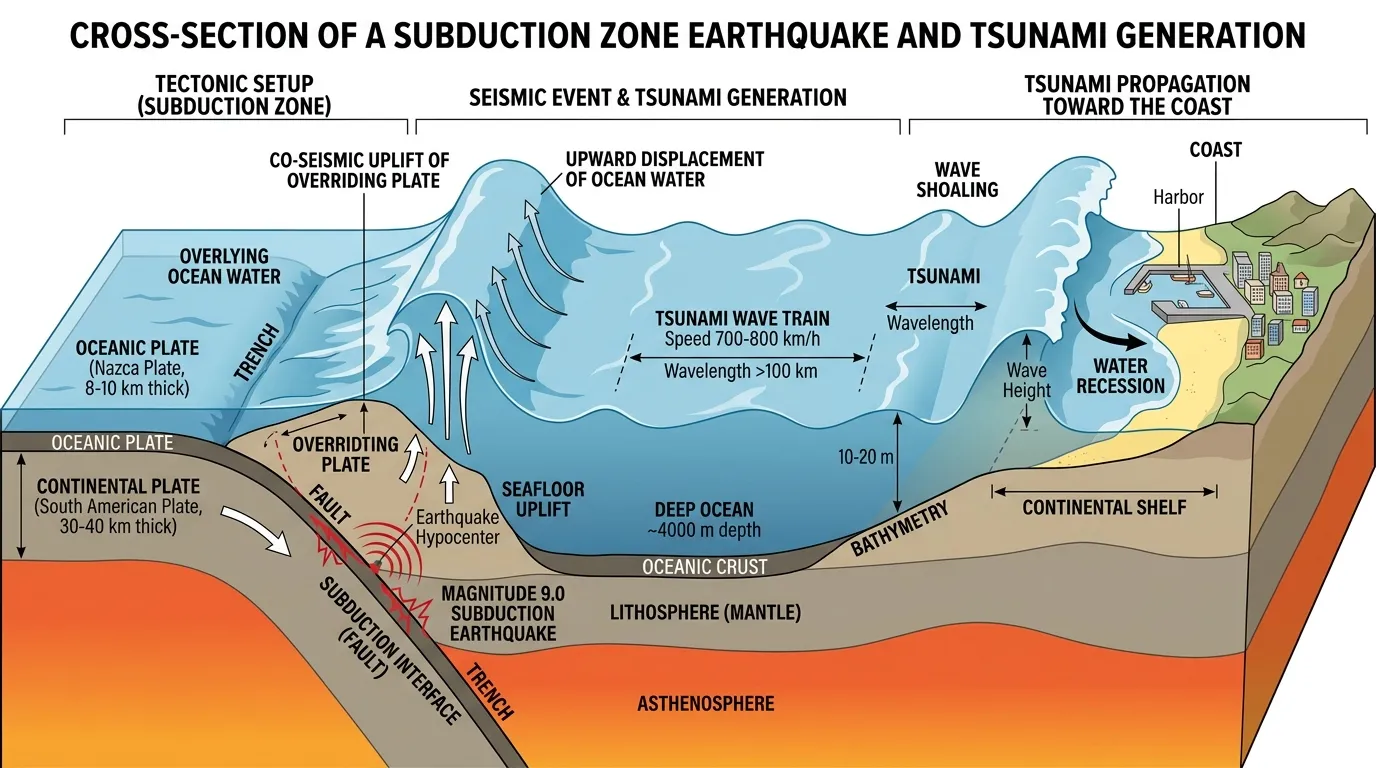
When a submarine earthquake causes a large section of the sea floor to suddenly shift vertically — typically at a subduction zone — it displaces an enormous volume of water, generating a tsunami. In the deep ocean, tsunami waves travel at 700–900 km/h — as fast as a jet aircraft — but are only half a metre or so tall and nearly impossible to detect from a ship. As they approach shallow coastal waters, they slow down and pile up dramatically, reaching heights of tens of metres.
The 2004 Indian Ocean tsunami, generated by the M9.1–9.3 Sumatra-Andaman earthquake, killed over 227,000 people in 14 countries — one of the deadliest natural disasters in recorded history. Today, international early warning systems using sea floor pressure sensors and tide gauges can provide coastal populations with warnings minutes to hours ahead of tsunami arrival, saving thousands of lives.
Not all large submarine earthquakes generate significant tsunamis — it depends on whether the fault motion has a significant vertical component. Strike-slip earthquakes in which rock moves horizontally are much less likely to generate tsunamis than thrust earthquakes in which one block is suddenly pushed upward relative to another.
Despite enormous scientific effort, reliable short-term earthquake prediction — knowing when, where, and how large — remains beyond our current capability. Earthquakes are fundamentally unpredictable because the stress state of fault zones deep in the crust is not directly observable, and the precise conditions under which a fault will suddenly rupture are extraordinarily complex.
What scientists can do is probabilistic forecasting — estimating the likelihood that a given region will experience an earthquake above a certain magnitude within a given time period. These hazard maps are the foundation of building codes and urban planning in earthquake-prone regions. They can’t tell you the earthquake will happen next Tuesday, but they can tell you that Los Angeles has about a 60% probability of experiencing a M6.7 or larger earthquake within 30 years — enough information to design safer buildings and emergency plans.
For a broader look at how Earth’s systems interact, you can explore our piece on The Structure of the Earth: Crust, Mantle, and Core or read Introduction to Paleontology to see how past geological events are recorded in fossil records.
Magnitude is a single number that measures the energy released at the earthquake's source — it's the same regardless of where you are. Intensity measures the effect of the shaking at a specific location — it varies with distance from the epicenter and local geology. A magnitude 7 earthquake might produce intensity IX shaking near the epicenter but only intensity IV shaking 200 km away.
Not reliably. No method has been shown to predict the specific timing, location, and magnitude of earthquakes in advance. Scientists can produce probabilistic hazard assessments — estimating the likelihood of significant earthquakes in a region over decades — but short-term prediction remains beyond current scientific capability.
P-waves (primary waves) are compressional waves that squeeze and stretch rock in the direction they travel — like sound waves. They are fastest and arrive first at seismographs. S-waves (secondary waves) shake rock perpendicular to their direction of travel. They arrive second and cannot pass through liquids, which is how scientists discovered Earth has a liquid outer core.
Many factors determine destructiveness beyond magnitude: depth (shallow earthquakes cause more surface shaking), local geology (soft sediments amplify shaking), proximity to population centres, building quality and construction standards, time of day, and whether a tsunami is generated. A magnitude 7.0 in Haiti in 2010 killed over 200,000 people; a magnitude 6.9 in San Francisco in 1989 killed 63 — largely due to differences in building construction and infrastructure.
After a main earthquake, the crust around the rupture zone adjusts to the new stress state, generating smaller earthquakes called aftershocks. Aftershocks can continue for months or years and occasionally are strong enough to cause additional damage. The largest aftershock is typically about one magnitude unit smaller than the main shock.